Detecting Cut Points on Challenging Applications
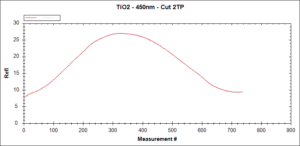
One of principal issues of optical monitoring and control is the ability to handle cut points on difficult or noisy applications. Making measurements when things are easy is by definition easy! It gets more difficult when the nature of the actual measurement becomes less stable caused by the actual process parameters. The following display has been created by an offline tool used at Telemark for testing the cut point algorithm offline. Notice that the blue trace has some noise but is easily filtered by the system as represented by the red trace. Actual cut point actions are made from the filtered data.
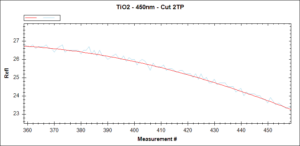
An expanded view of one area gives you a better perspective of the variation in signal do to systematic noise.
In this case one can see the variation caused by the systematic noise in the system. The deposition was done using electron beam deposition of TiO2 at moderate deposition rates. The substrate was in good control so the variation was quite limited to a statistically small percentage of the absolute measured intensity. Good cut points can be achieved with limited filtering of the base data.
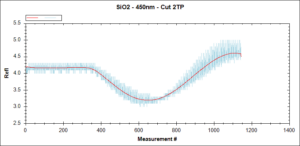
Contrast this with the following data taken from a reactive sputter deposition of SiO2. The substrate was rotating with a table that was not flat. The resulting deviation of the beam results in a real measurement variation of .6% absolute on a 4.6% reflectance or about 13% error. The cut point algorithm is looking to discern a change of about .005% absolute or .1% of the signal or better.
If cut points were determined on the basis of the raw blue trace the error would be significant. With the adaptive filtering in the NVision Optical Monitor the system setup determines the cut point based on the filtered data delivering an endpoint to the layer that is both precise and timely.
Please contact Telemark at sales@telemark.com to find out how Telemark/NVision Optical Monitoring systems can improve your yields and profitability.


